Unraveling a Database Performance Mystery: The Tale of Unexpected Bloat and IOPS Surges

I'm a software engineer with nearly five years of experience specializing in Python, Golang, DevOps, and Cloud technologies. As a former Tech Lead, I have led diverse teams and worked on eCommerce, Banking, Real Estate, and Machine Learning/AI projects. I excel in collaborating with clients to develop scalable, high-performance solutions.
It was just another Monday at Certa, where a team of engineers had completed a significant deployment over the weekend. The mood was upbeat as everyone settled in for the start of the workweek. But the serenity was deceptive; a subtle issue brewing would soon disrupt operations.
The First Signs of Trouble 📞
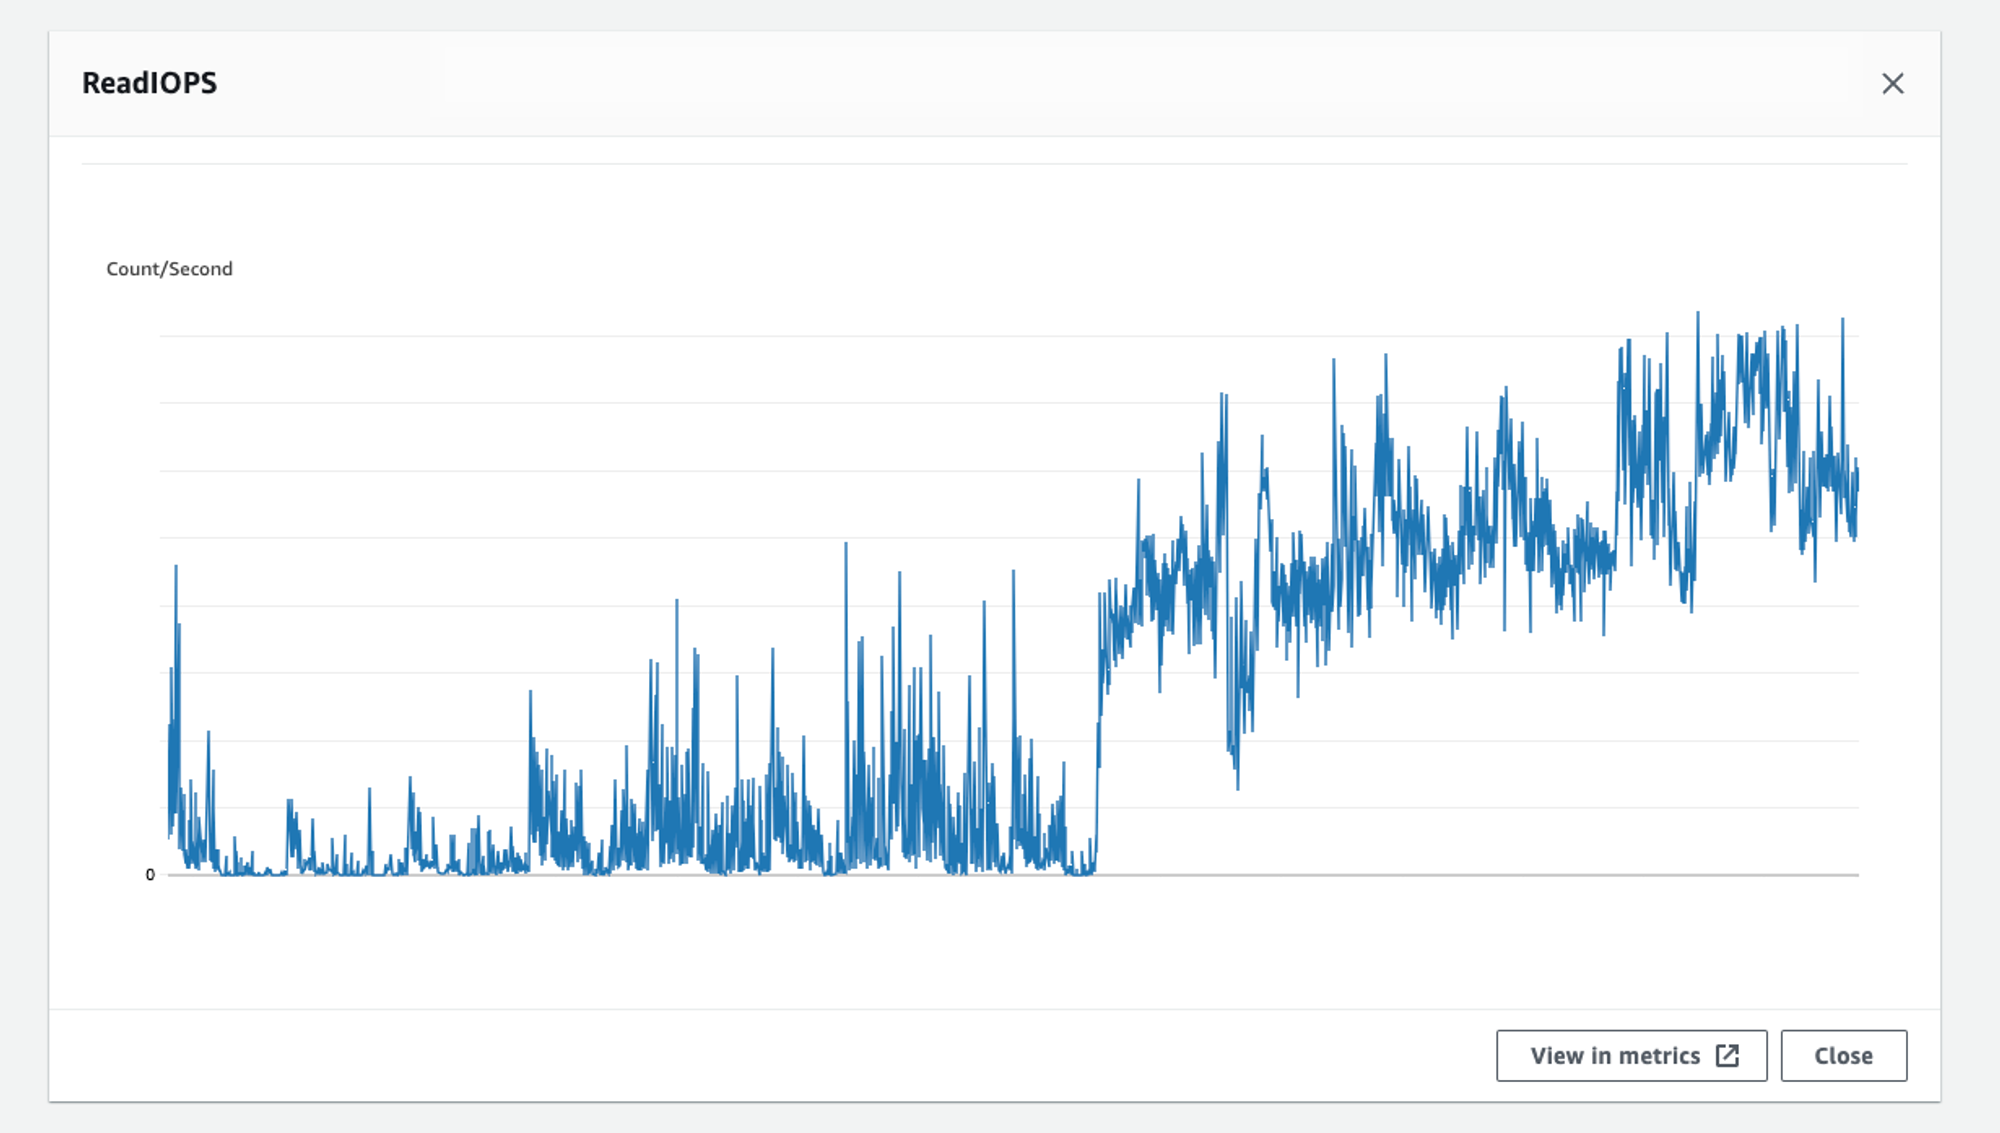
On Tuesday, we noticed a minor uptick in database activity. The Read IOPS on the main database started climbing. Initially dismissed as a minor fluctuation, after monitoring it for some hours, it was clear something was wrong. The database was straining under an unexpected load, and the effects soon rippled through the system.
The Impact Spreads 🧨
As the week went on, our DevOps team began receiving alerts about high-read IOPS. They sprung into action involving a few platform engineers, and promptly began the investigation. Meanwhile, several clients reported high latency across multiple features to our customer success team.
The Investigation Begins 🕵🏽♂️
To identify the root cause, we delved into the monitoring dashboards, examining metrics and logs to understand what was driving the increased read IOPS. When we compared metrics from the last two weeks, we saw a steep rise in the read IOPS count, with no sign of decline.

The Discovery 💡
Further investigation revealed a troubling execution plan within one of the database schemas. An EXPLAIN ANALYZE query showed some operations were taking far longer than expected, leading to a cascade of delays and increased read IOPS. In such cases, VACUUM ANALYZE always comes as a lifesaver, so we ran the command to refresh the stats and generate an optimized query plan. When we checked the dashboards for clues, we noticed that the autovacuum command was running continuously. We focused on it and checked what was happening. The database automatically triggers this command whenever the bloat size crosses a threshold limit, and when we checked the stats, we found out that this was indeed what had happened with our database.

SQL query:
SELECT schemaname, relname, n_live_tup, n_dead_tup, trunc(100*n_dead_tup/(n_live_tup+1))::float "ratio%",
to_char(last_autovacuum, 'YYYY-MM-DD HH24:MI:SS') as autovacuum_date,
to_char(last_autoanalyze, 'YYYY-MM-DD HH24:MI:SS') as autoanalyze_date
FROM pg_stat_all_tables
ORDER BY n_dead_tup DESC;
More technical details for those who are interested…
Let’s take a pause and understand a few technical details before continuing the story.
Understanding dead tuples in PostgreSQL
When deleting rows in PostgreSQL, the database does not actually remove them but marks them as dead tuples. One might think that it would be easier to delete the row when performing the delete operation, instead of relying on something like
vacuum, right? But there are reasons for not doing it, which are:Recovery and rollback
During the execution of a
DELETEoperation, the database cannot just delete the record without committing the transaction because it may fail or be aborted at any point in time, leading to the need for a rollback and restoration of a previous version of the record.Concurrency Control
PostgreSQL uses MVCC to manage concurrent transactions without locking the database tables. Instead of locking rows, it maintains multiple versions of a tuple. This allows readers to access the previous versions of the data while writers are modifying it, enabling better performance and less contention.
By marking tuples as dead rather than deleting them immediately, PostgreSQL ensures that transactions running in parallel can continue to see a consistent view of the data according to their isolation level. Deleting tuples outright could violate this consistency.
For example, consider two transactions running in parallel.
Transaction T1 performs a
SELECToperation on a dataset and then Transaction T2 performsDELETEon a few rows in the same dataset just after some time.The view of transaction T1 is locked and does not change until it completes hence deleting those rows by another transaction would not be a good idea.
Instead, transaction T2 actively marks those rows as dead, allowing T1 to still see and return the previous copy so that the user can view a version of the rows at the time it was requested.
Now instead of returning, T1 performs any
UPDATEoperation after T2 marks it as dead, commits, and raises a serialization error indicating the record has been updated, forcing T1 to refresh the data before performing any update.
Index Maintenance
Marking tuples as dead simplifies the handling of indexes. Deleting tuples immediately would require updating or removing corresponding index entries right away, which could lead to additional complexity and performance overhead.
What is “bloat”?
Database bloat refers to the excessive accumulation of "dead tuples" or obsolete data in a database. Bloat happens when dead tuples pile up faster than the database can clean them up. For example, if the application updates or deletes 1,000 records per second, but the autovacuum daemon can only remove 800 dead tuples per second, 200 dead tuples are left behind every second, causing bloat. This is just a hypothetical example—it's not possible to fine-tune the
autovacuumdaemon to such specific rates.Problems caused by database bloat
In Postgres, the query planner decides the best way to execute a query. It looks at table statistics, indexes, and data types to recommend the most efficient execution path. When a table is bloated,
ANALYZEin Postgres can provide inaccurate information to the query planner, causing slow queries and increased disk I/O operations due to the processing of unnecessary data.For instance, if a table has 350 million dead tuples but only 50 million active rows, the bloat score is 7 (a 7:1 ratio of dead to active rows). This high bloat score leads the query planner to make poor decisions, resulting in slow queries. During query execution, PostgreSQL loads both live and dead tuples into memory, which increases disk I/O and degrades performance because it has to process unnecessary data.
VACUUM and
autovaccumfor cleaning bloatVACUUM command can be used to manually clean up these dead tuples and reclaim the space. PostgreSQL also provides autovacuum functionality which automates vacuum activity. By default, Postgres triggers cleanup when dead tuples make up 20% of the table. Based on your database workload and performance requirements, you have the option to adjust various settings. However, the
autovacuumprocess uses resources like CPU, memory, and disk I/O, which can affect the database’s regular operations.To learn more about this, refer to "Understanding Autovacuum in Amazon RDS for PostgreSQL Environments.”
The Search for a Solution 🔍
Now there were two questions that we were asking ourselves.
Why does bloat size increase so much even though
autovacuumis running continuously?How could we speed up the removal of table bloat from the database?
While we were still seeking answers to the first question, we didn’t want the customer experience to suffer. Therefore, we prioritized addressing the symptoms and began exploring potential solutions. Each option had advantages and disadvantages, demanding us to carefully evaluate the potential downtime and challenges, particularly in a production environment. Since finalizing a solution was going to take some time, we opted for a short-term fix by increasing provisioned IOPS to ensure a seamless customer experience.
Then, another problem was reported at the same time 😵
Everything was working fine for our clients, and we were still searching for answers to our first question while preparing a solution. Then another issue arose, requiring our immediate attention. Our analytics database, which is a read-only replica of the main database, became slow, causing one of our clients to experience problems generating daily analytic reports. Our investigation revealed that our replica database was consistently running at over 98% load. We scaled up the database vertically in order to swiftly address this issue and ensure the client could continue working without experiencing slowdowns.
What the… So, this is what happened… 🤔
After scaling our replica database, it restarted, causing a drop in CPU load. To our surprise, the bloat size in our main database also decreased rapidly. Initially, we thought this might be because of the increased IOPS capacity. However, further investigation revealed the true cause.
We discovered a few queries had been running for a long time on our replica database. Upon checking the configuration, we noticed that hot_standby_feedback was enabled, which caused the problem. Enabling the hot_standby_feedback parameter on the replica instance usually prevents vacuum from removing dead row versions needed by running queries on the replica. This prevents query conflicts or cancellations and delays the cleanup of dead rows on the primary database, which can lead to table bloat. In our case, when the read replica database restarted during the instance scaling process, It canceled all active sessions. This allowed the autovacuum process to complete in the primary instance, reducing read IOPS.
While we worked on a long-term solution, the problem recurred in a few days. This time, we checked the replica database for long-running queries and discovered the same issue. We terminated those long-running queries rather than restarting the database. Within a few hours, the bloat size returned to normal, and the application performance improved.
More technical details 🖥️
Dead tuples are created to ensure concurrency when two transactions are running in parallel and working on the same dataset. But what if those transactions are running on two different servers, the main server and a replica? Rows are marked as dead, so they will still exist, and even after replication, the replica server will know which rows are marked as dead. However, a problem arises when autovacuum runs on the main server because when these dead tuples are deleted, the same will be reflected on the replica. What if there is a transaction that still uses those rows? This will cause replication conflicts.
To prevent such conflicts, PostgreSQL provides the hot_standby_feedback toggle. When enabled, the replica periodically sends information about the oldest transaction that is running. With this information, VACUUM can delay cleaning up certain rows, thus avoiding replication conflicts. However, if a query runs for a long duration or never terminates, these dead tuples will accumulate, resulting in database bloat.
Lessons 📝
The database is the backbone of your application, so it is crucial to configure it properly to ensure optimal performance and reliability. In our case, we had
hot_standby_feedbackenabled but had improperly configured the timeout parameter to terminate long-running queries. Although we had alerts enabled, these queries went unnoticed because of the incorrectly configured time parameter. We had to reconsider various factors to determine the optimal time parameter and reconfigure it accordingly.These parameter values may vary depending on the use case, so it is always recommended to understand your specific use case before configuring them.
We use replica db to fetch analytic reports, while most queries we run there are reviewed first. Those long queries were the ones that were not audited and those ended up biting us in back. So we learned to always allow audited queries that won't cause resource starvation for other queries.
Customer experience is of utmost priority. While working on long-term solutions, ensure you provide quick resolutions that make the customer’s life easier.
Additional Information 📃
We also explored the following options to clean up the bloat, but fortunately didn’t need to use:
-
Pros: It can be faster than
VACUUM ANALYZEand will remove all bloat in the table while shrinking the table’s physical size on disk.Cons: It requires an exclusive read/write lock on the table for the operation’s duration, which can cause application outages depending on the table size.
-
Pros: Very fast and doesn’t require a read/write lock on the table.
Cons: It is very resource-intensive, which can degrade overall database performance. It can also cause significant replication lag and OutOfMemory errors when using replication slots.
-
It performs the same function as
pg_repackby modifying the rows in place.However, it uses significantly fewer resources and operates much slower, making it less problematic for replication slots.
Despite this,
pgcompacttablewas too slow to effectively remove the amount of bloat we had.
References 🔗
Understanding Postgres IOPS: Why They Matter Even When Everything Fits in Cache
Remove bloat from Amazon Aurora and RDS for PostgreSQL with pg_repack
Bonus Content 🤓


